The graph above compares the 5-year cost of ownership for all of Audi’s vehicles. This is a mix of some 2011 as well as 2012 model year vehicles. Please refer to the table below to see which specific models and variations thereof are being depicted in the graph.
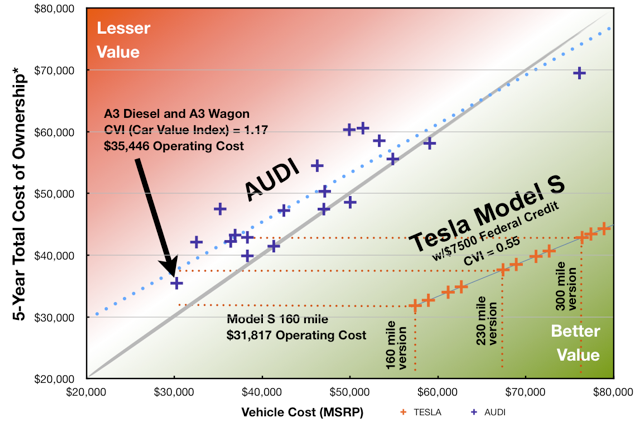
The most interesting thing you’ll see is that all of the Audi’s are clustered in a pattern that form a diagonal line. There seems to be almost a 1:1 relationship between the price of an Acura and what it costs to operate it, but upon closer inspection, the 5-year ownership costs is a bit higher than the car price. Dividing the ownership cost by the car price reveals the true relationship, that is, how much of the car cost does it take to operate it for 5 years vs its sticker price? (The diagonal gray line represents a 1:1 ratio where the car price is equal to the 5 year ownership cost). You’ll also observe that the ownership cost of the A3 Diesel Sedan or the A3 Wagon is actually higher than the owenrship cost of the Tesla Model S, and ironically, the Tesla Model S costs almost twice the price of the that of the Audi A3 vehicles!
If you look at the table below, you’ll see that the price of the A3 cars is $30,250 while the ownership cost is just a bit higher at $35,446. How much higher? Let’s calculate it.
$35,446 5-Year Ownership Cost / $30,250 MSRP = 1.17
Thus, both A3‘s have an ownership cost that exceeds the price of the car by 17% since it is 1.17 times greater. This number is very useful. It reveals that the A3 Diesel sedan and that the A3 Wagon are both more expensive to use over a 5 year period, than they are each to buy!
5-Year Ownership Cost / Price of car = Car Value Index
We found this index useful too in comparing cars to each other. It reveals car value. Basically, if a car costs less to operate than the price, then its clearly a better deal, that is, of course, if the car is priced fairly based on its style, options and features. So we gave this index a name. We call it the “Car Value Index” , or “CVI”. A CVI below 1.0, means the car is cheaper to operate than it is to purchase, or more expensive to operate than it is to buy if it is is greater than 1.0. You can read more about it here: New Car Value Index Reveals Best Deals.
A Car Value Index of 1.17 is pretty average for a gasoline-fueled car. The Audi A3s have a depreciation rate of 60% in 5 years, so they lose more than half of its value in that period of time. That’s not as bad as some Saab, Mercedes and other Audi vehicles that lose 70% of their value within that same time period, but not as good as some Nissan vehicles that only lose 37% of their value. The Audi have a somewhat high average cost for maintenance and repairs that approximate $7,800. That’s not nearly as bad as some vehicles that have repair and maintenance costs that approximate $16,000! Nevertheless, The Tesla Model S is clearly a better value.
In the table below, depreciation is displayed in the “DEP” column. “MSRP” is the Manufacturer Suggested Retail Price. The “SAVINGS” column reflects how much you would save in a 5 year period by purchasing a Tesla Model S instead of the Acura on that line.
The Tesla Model S is cheaper to operate than any of Audi’s car models and configurations. Their cars cost anywhere from a bit over $30,000 to about $78,000, with one model approximating $172,000. Ironically, the $59,000 Audi S5 convertible cost just $1,600 more than the Tesla Model S, but costs about $58,000 to operate; almost twice the operation cost of the Model S.